Aerial view of a manufactured home community at twilight
Now Accepting Accredited Investors

Income-producing real estate, built for the long term.

Sonos Capital offers accredited investors direct access to a professionally managed portfolio of manufactured housing communities — a recession-resilient asset class with quarterly distributions.

Avg Net IRR (since 2002)

26%

Equity Multiple

4.28x

Founded

2017

Track Record

20+ Yrs

The Opportunity

Why sophisticated investors are turning to manufactured housing.

For decades, manufactured home communities sat overlooked. Today, they're recognized as one of the most defensible cash-flowing asset classes in real estate — and Sonos Capital is positioned at the center of that institutional shift.

01

A $100B+ fragmented market

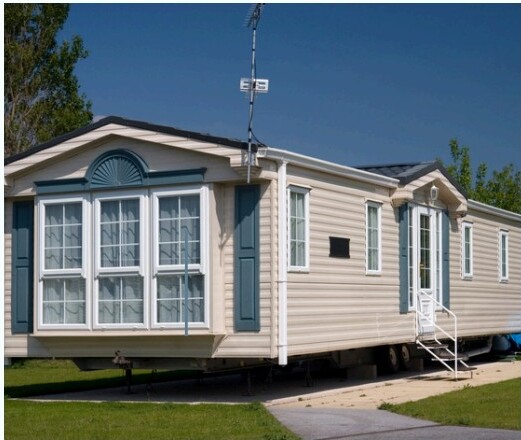
Manufactured housing is the largest source of unsubsidized affordable housing in America — yet over 85% of communities are still owned by mom-and-pop operators. Consolidation has only just begun.

02

Demand outpaces supply

Restrictive zoning makes new communities nearly impossible to build. Existing parks operate near full occupancy with rising rents and minimal turnover.

03

Resident-owned homes, investor-owned land

Residents own their homes and rent the land beneath them. The result: extraordinarily long tenant tenure, low capex, and predictable, durable cash flow.

Built for investors who value predictable income and disciplined execution.

01

We buy directly

Most MHC transactions are off-market. We cultivate long-standing relationships with property owners, avoiding broker markups and uncovering value others miss.

02

We manage in-house

Each community is managed by a dedicated on-site team trained and supported by Sonos. This ensures operational consistency and a high-quality resident experience.

03

We underwrite conservatively

We target stable, cash-generating communities in landlord-friendly states, acquiring below replacement cost while often leveraging seller financing.

04

We reposition with purpose

Our multi-phase upgrade plan includes rebranding, infrastructure repairs, infill homes, and amenities like dog parks and open green space.

05

We promote homeownership

Through partnerships we help residents transition from renters to homeowners — reducing turnover and enhancing community pride.

06

We build long-term wealth

Strategic acquisitions and purposeful repositioning drive both immediate cash flow and long-term appreciation.

timeline property
UPCOMING ACQUISITION

Gillette, WY

382 Space Mobile Home Park

ESTIMATED CLOSING
1st Qtr 2026
HOLD PERIOD
7 yrs
ACQUISITION COST
$15,000,000
TOTAL CAPITAL
$7,000,000
EQUITY INVESTMENT
$5,000,000
ANNUALIZED CASH YIELD
18.8%
PROJECTED EQUITY MULTIPLE
2.86x
PROJECTED IRR
23%

Two decades of disciplined real estate investing.

Founders' track record since 2002 — delivering a 4.28× total average equity multiple on capital invested across 20 full-cycle assets.

Operating Assets

Property Location Description Date Hold (yrs) Purchase Price Equity Invested Cash Yield Projected Equity Return Projected Equity Multiple Projected IRR
Globe, AZ 102 Space Mobile Home Park May 2024 1.0 $2,000,000 $500,000 37.0% $1,768,333 3.54x 28%
Fountain, CO 27 Space Mobile Home Park Sept. 2025 0.4 $750,000 $375,000 11.7% $1,172,600 3.13x 33%
Totals / Averages 0.7 $2,750,000 $875,000 9.9% $2,940,933 3.36x 30%
*Projected Total Return, Projected Equity Multiple, and Projected Annualized IRR based on a 6% cap rate.

Full Cycle Assets

Property Location Description Date Hold (yrs) Purchase Price Equity Invested Cash Yield Total Return Equity Multiple Annualized IRR
Avondale, AZ Single Family Home Rental Sept. 2002 2.3 $140,000 $14,000 0.0% $163,000 11.64x 9%
Glendale, AZ 6 Unit Apartment Dec. 2003 1.5 $180,000 $40,000 10.0% $252,000 6.30x 16%
Phoenix, AZ Single Unit Loft Rental Jan. 2003 4.4 $192,000 $19,200 3.8% $309,000 16.90x 6%
Mesa, AZ Single Family Home Rental Feb. 2004 1.0 $160,000 $50,000 0.0% $100,000 2.00x 50%
Phoenix, AZ Urban Infill Lot Aug. 2005 1.7 $20,000 $20,000 0.0% $80,000 4.00x 25%
Phoenix, AZ New Construction Townhome Dec. 2004 1.0 $199,000 $199,000 0.0% $329,000 1.65x 60%
Phoenix, AZ 2 Unit Apartment Jun. 2005 2.0 $180,000 $36,000 0.0% $156,000 4.33x 23%
Glendale, AZ Single Family Home Rental Jan. 2005 3.0 $210,000 $70,000 2.3% $154,400 2.21x 45%
Denver, CO Single Unit Condo May 2007 0.3 $160,000 $32,000 0.0% $102,000 3.19x 31%
Denver, CO Single Unit Condo July 2007 3.4 $440,000 $88,000 0.0% $73,000 0.83x -5%
Austin, TX Single Family Home Rental Nov. 2006 2.4 $210,000 $42,000 2.9% $156,500 3.73x 27%
Phoenix, AZ Single Unit Condo July 2005 4.0 $218,000 $21,800 0.0% ($36,200) -1.66x N/A
Scottsdale, AZ Single Unit Condo Dec. 2006 2.6 $536,000 $53,600 0.0% ($32,400) -0.60x N/A
Tucson, AZ Duplex Rental Sept. 2012 0.8 $160,000 $50,000 9.0% $92,800 1.86x 54%
Phoenix, AZ Triplex Rental Dec. 2016 1.7 $135,000 $13,500 0.0% $143,500 10.63x 9%
Phoenix, AZ 16 Unit Apartment Mar. 2017 1.0 $975,000 $100,000 0.0% $625,000 6.25x 16%
Yuma, AZ 62 Space Mobile Home Park Sept. 2014 0.1 $1,000,000 $100,000 0.0% $200,000 2.00x 50%
Phoenix, AZ 4 Unit Apartment Sept. 2017 1.7 $305,000 $5,000 0.0% $69,000 13.80x 7%
Southeast, AZ 155 Space Mobile Home Park Sept. 2017 3.1 $900,000 $430,000 52.3% $2,982,250 6.94x 19%
Casa Grande, AZ Duplex Rental Sept. 2012 0.5 $90,000 $12,000 0.0% $62,000 5.17x 19%
Totals / Averages 1.9 $6,410,000 $1,396,100 8.1% $5,980,850 4.28x 26%
Weighted average Yield and IRR are weighted on sum of fair value and distributions. Total Capital includes all investors, both Sonos Capital entities and other investors.
FULL TRANSPARENCY

Quarterly distributions, every quarter.

Sonos Capital's mission is to be as transparent as possible — to give our investors the utmost confidence that their capital is in the best possible hands. Below is the published distribution calendar for 2026 and 2027.

  • Paid distributions and preferred returns every quarter
  • Quarterly investor updates
  • 4.28× total average equity multiplier
  • K-1s by March 1st annually

2026

DISTRIBUTION SCHEDULE

November 14

Q1

February 14

Q2

May 15

Q3

August 14

Q4

November 14

Q5

2027

DISTRIBUTION SCHEDULE

February 14

Q1

May 15

Q2

August 14

Q3

November 14

Q4
FAQ

Here for you.

Sonos Capital's approach to proactive communication helps provide investors with answers to questions before they arise.

Quick Facts

  • No 1031 Exchanges allowed
  • Self-Directed IRA accepted
  • K-1s by March 1st annually
  • 90 days in fund before distributions
  • No compounding of distributions
  • Fund I started 2017, exited 2022

Yes, depreciation benefits may pass through to investors depending on fund structure and tax treatment.

Cost segregation studies are performed strategically to maximize depreciation benefits.

Properties are managed internally through dedicated operational teams.

Depreciation is allocated proportionally according to investor ownership interests.

Request the investor packet.

Available exclusively to accredited investors. Reach out to receive the full offering materials and schedule an introductory call with our team.